

The most interesting fact here is that; If we compare the list of most desired jobs and job profile in India with that of few developed nations, we will see a clear demarcation there. Indian society and education system have always presented jobs like a doctor or an engineer to be the most prestigious ones, whereas, students in developed countries have always considered trading as one of the most preferred space and becoming a ‘Bond Trader’ leads the chart and aspirational value amongst the B-School students.
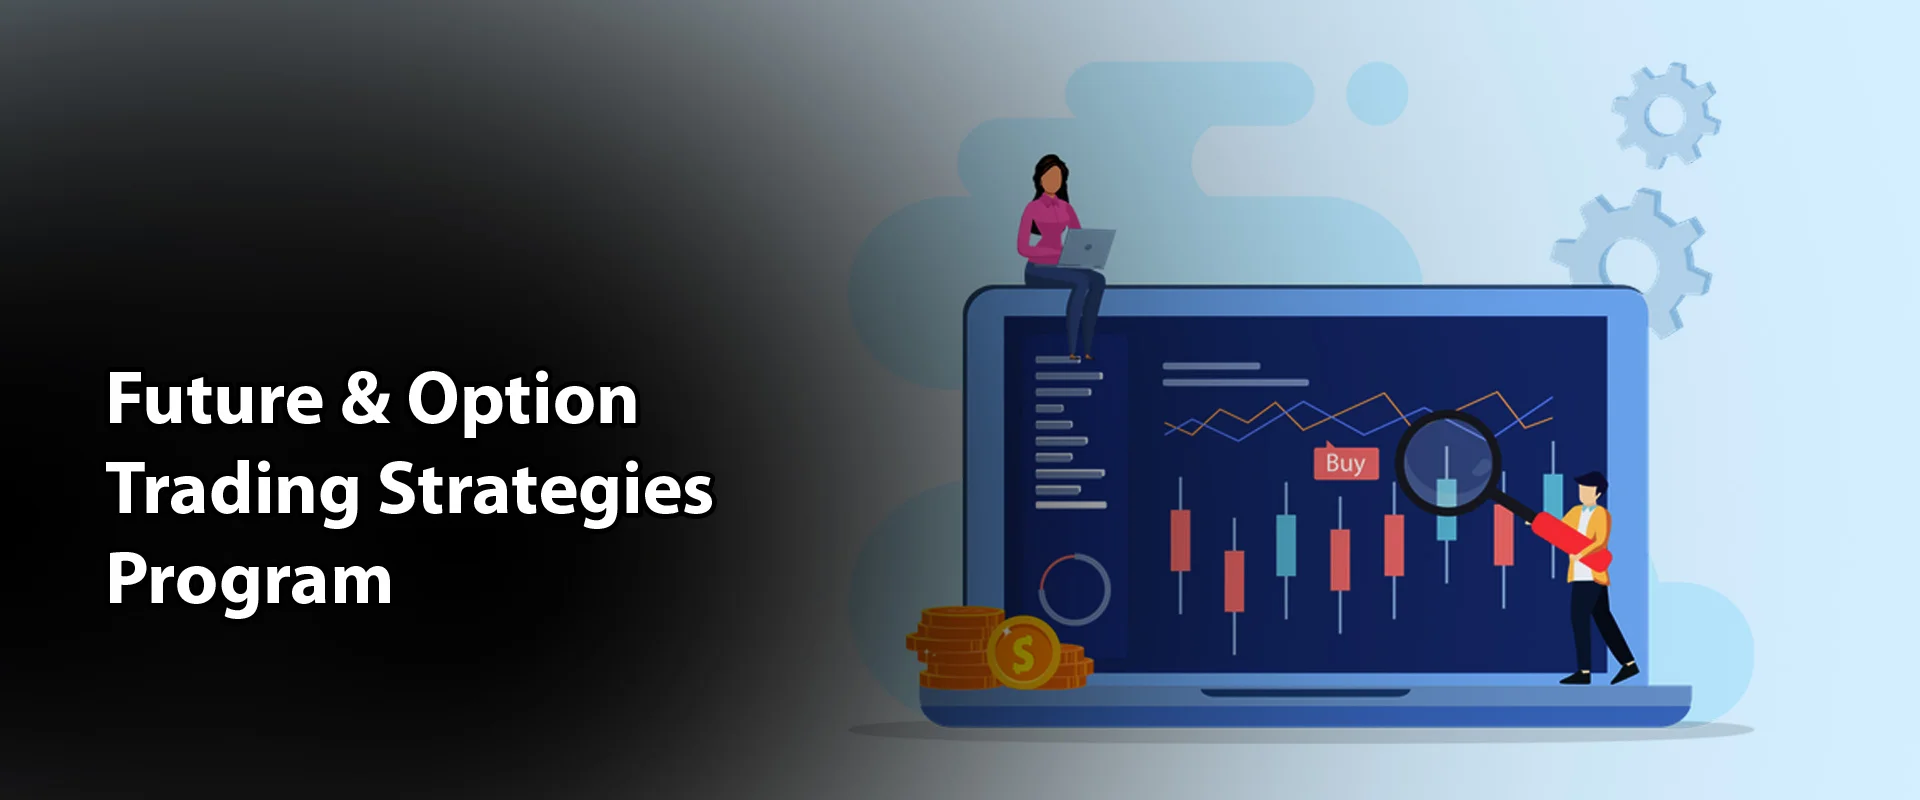
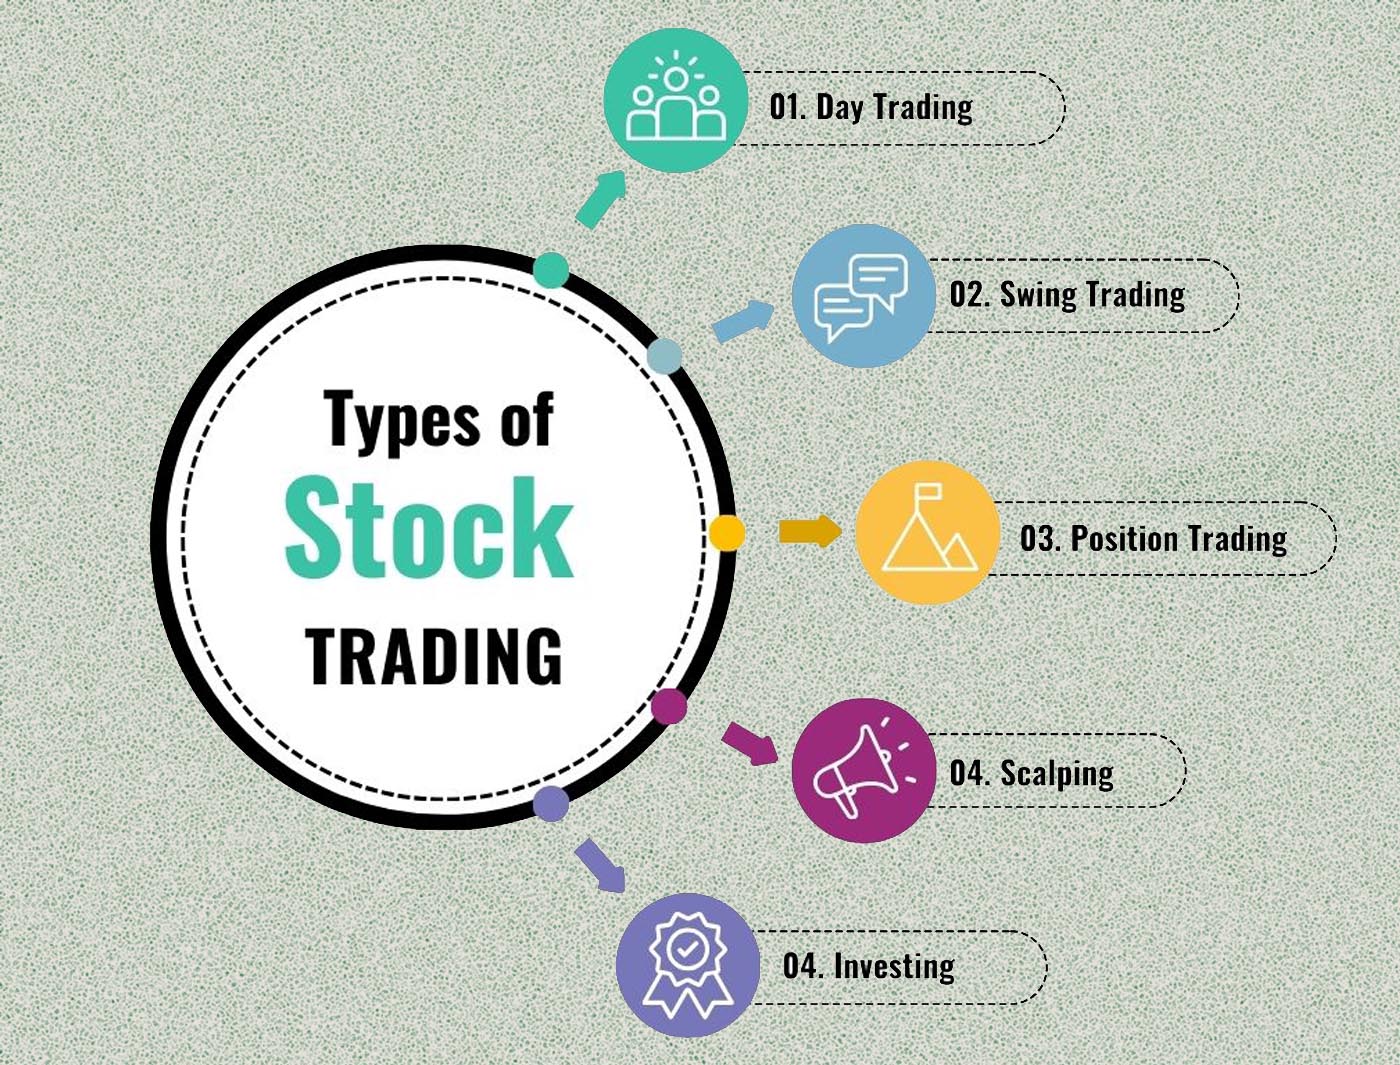
We endeavor to assist you with meeting your monetary objectives with a complete educational plan. Our courses are intended to cover a range of interactive courses and in-depth course material including Swing Trading, Short Term Trading, Position Trading, and Investment Theory for Stocks, Futures & Options.
Our mission to bridge this gap by providing comprehensive education and resources, making stock market knowledge accessible to all. Academy works with an honorable thought process of providing training to the youthful age to grow its monetary areas.
At the Academy, we envision ourselves as the leading provider of high-quality stock market education in India. We are committed to fostering a generation of confident and informed investors, equipped to make sound financial decisions.Our visionto upgrade your insight on trading.
We focus on helping you understand markets better & learn to analyze charts on your own & not just sell you a strategy that is not enough on its own. We help you design your crucial Trading Plan therefore, you will always have an Entry Plan & Exit Plan. Being Unbiased in the Stock Market is a Blessing.
Institutional traders use a variety of tools to make trading decisions and manage risk. Some of the most common tools used by institutional traders include:
It’s worth noting that institutional traders often use a combination of these tools and may also use additional tools that are specific to their trading strategies and the markets they trade-in. Techniques like Market Profile, Volume Profile, and Order Flow Trading play a significant role in shaping strategies, making these tools indispensable for professional traders.
Order flow trading is a type of trading strategy that involves analyzing the flow of orders for a financial instrument to predict future price movements. It is based on the idea that the order flow, or the number and size of buy and sell orders, can indicate market sentiment and reveal information about future market conditions.
Traders who use order flow trading strategies typically focus on analyzing the order book, which is a record of all buy and sell orders for a financial instrument. They may also use other tools such as volume profile, auction market theory, and footprint charts to help them understand the order flow. Techniques like market profile also play a crucial role in interpreting market behavior and identifying potential trading opportunities.
Order flow traders often focus on short-term trades and use real-time data to make decisions. The strategy is commonly used in futures, forex, and equities markets but can be applied to other markets as well. Many traders learn these advanced techniques, including order flow trading, volume profile, and market profile, through expert guidance provided by the best trading academy in India.
It is important to note that order flow trading requires a high level of technical expertise and can be complex and challenging, making it unsuitable for every trader. It is essential for traders to have a solid understanding of market dynamics, technical analysis, and risk management before attempting to use order flow trading strategies. Training from the best trading academy in India can provide valuable insights and skills needed to master this sophisticated trading approach.
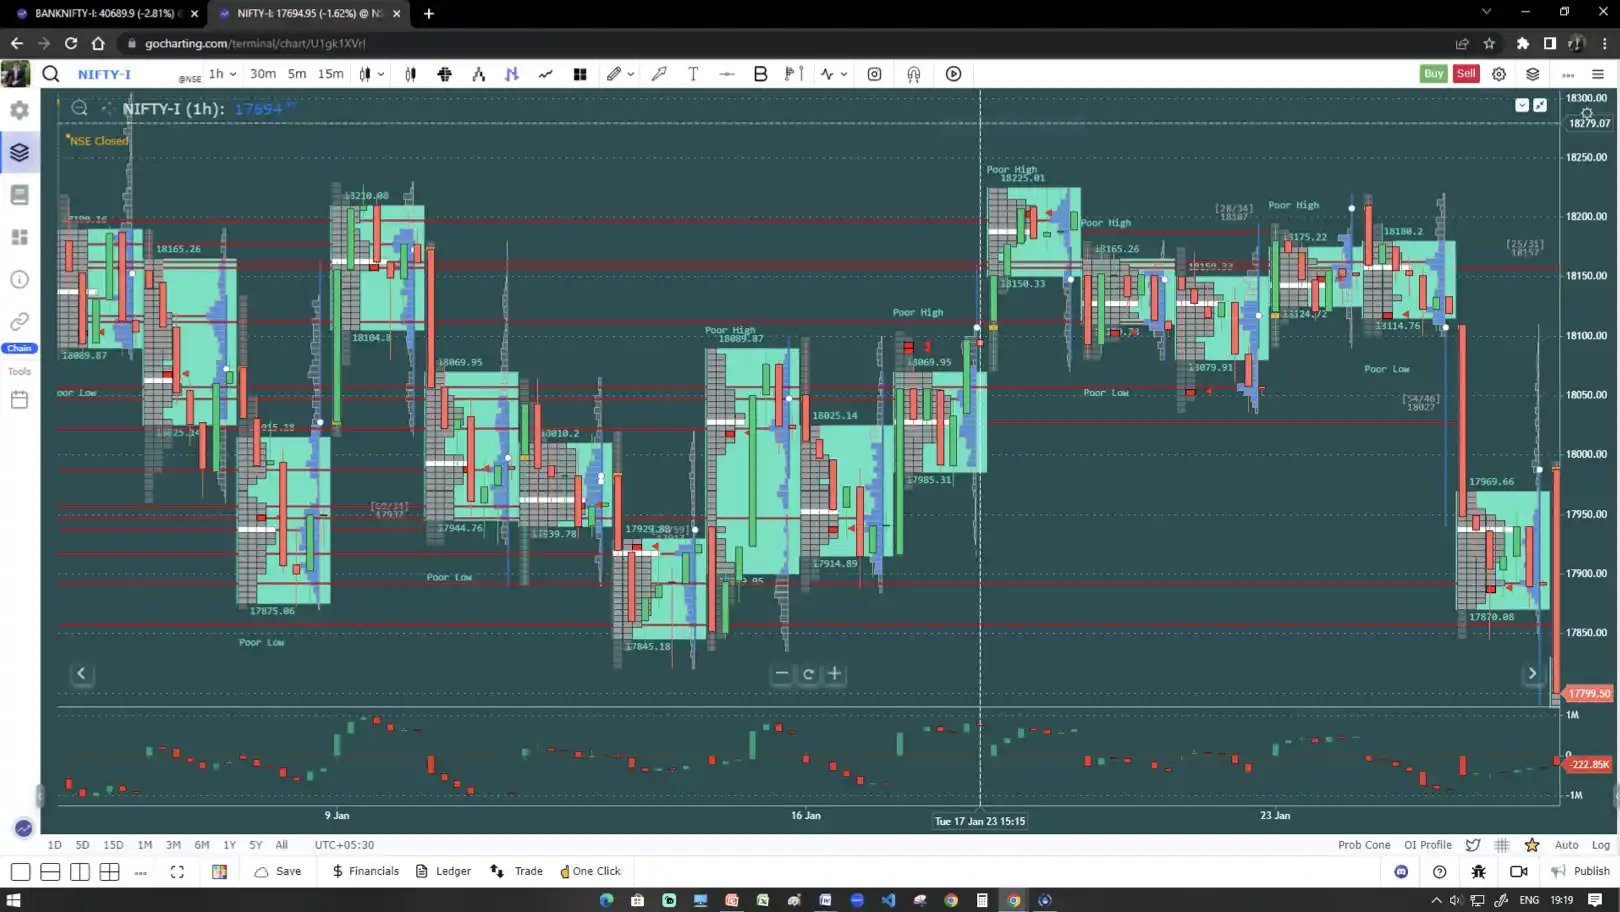
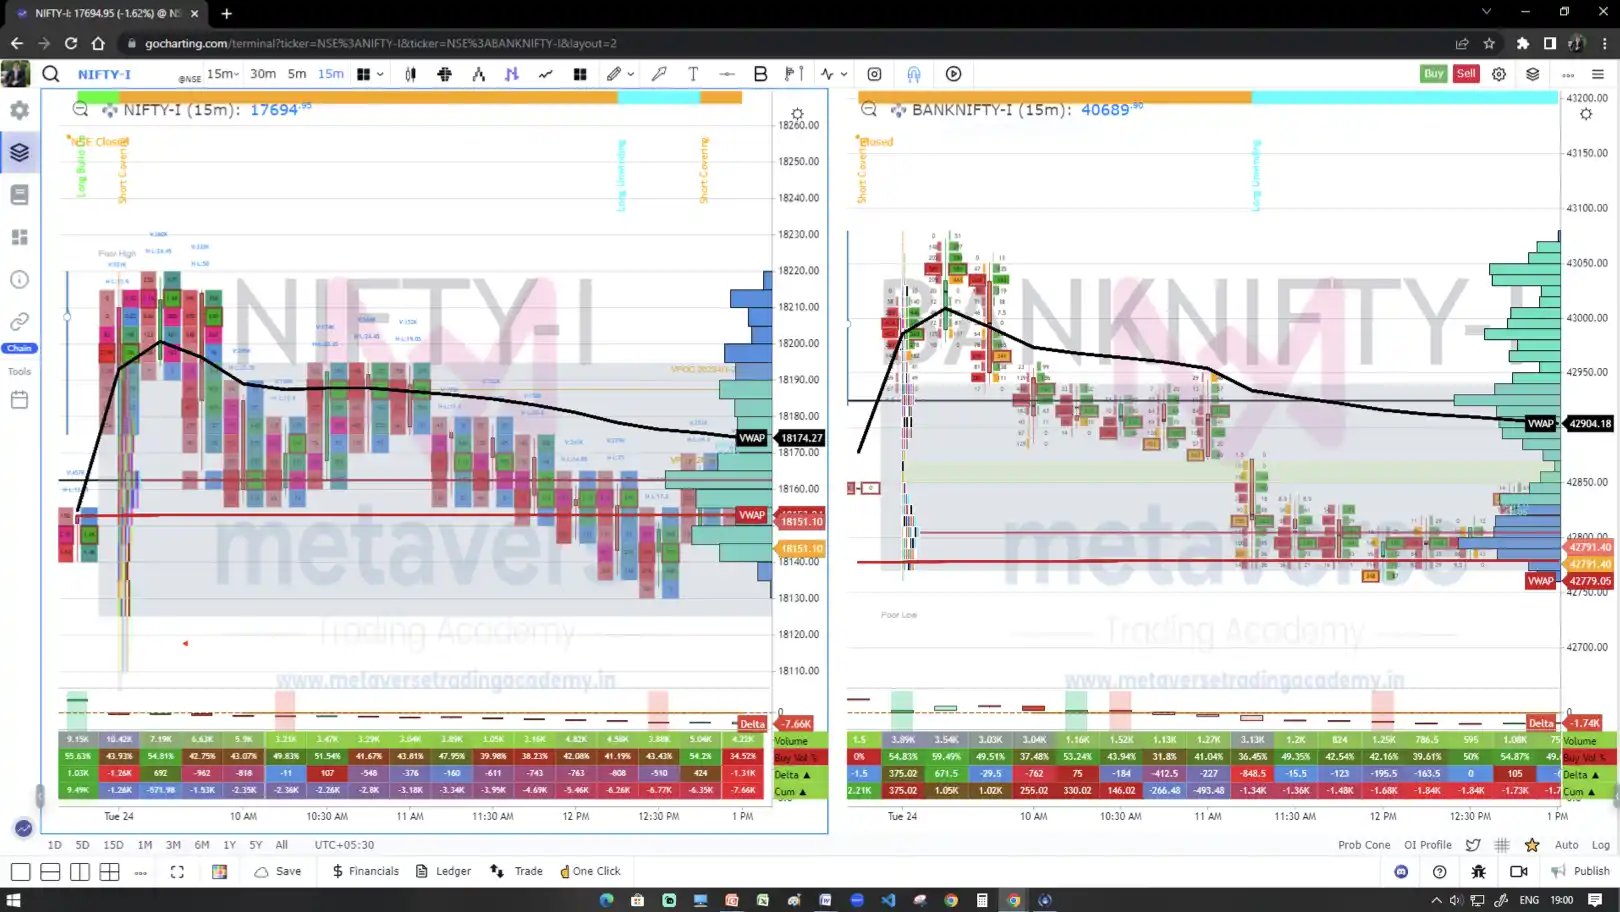
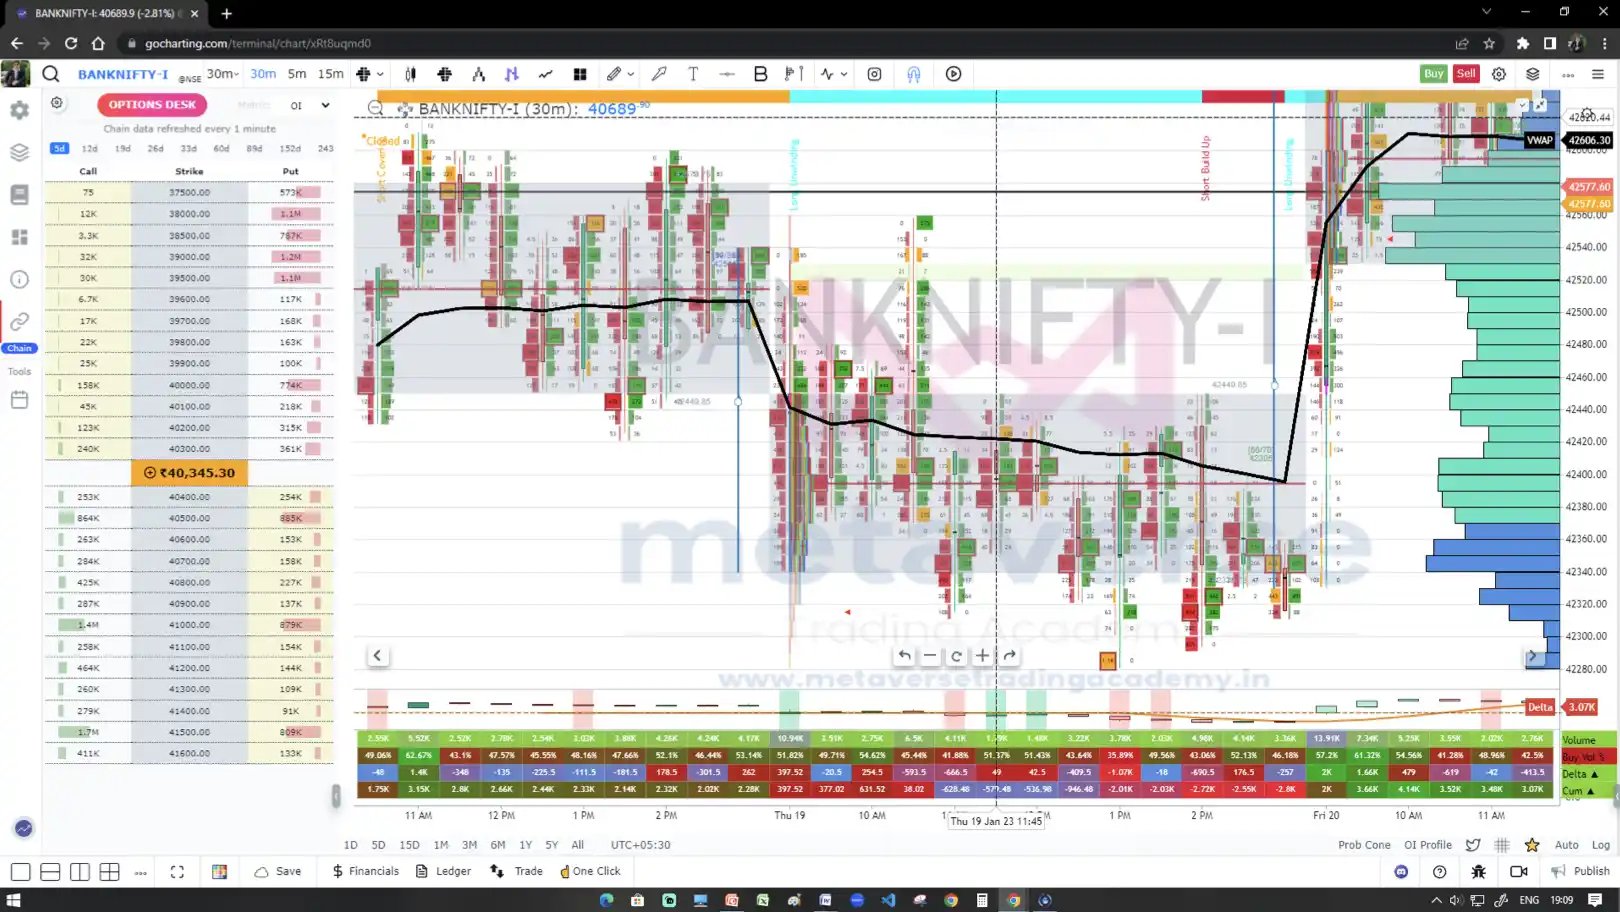
Market profile is a type of charting method that was developed by J. Peter Steidlmayer in the early 1980s. It is based on the idea that the price and time of a financial instrument can provide insight into the buying and selling activity of market participants and can be used to predict future price movements.
The market profile chart is a graphical representation of the trading activity for a particular financial instrument during a specific time period. It is divided into vertical “time price opportunities” (TPOs), which are horizontal blocks that represent a specific price range. The height of each TPO represents the volume of trades that occurred within that price range during a given time period. Techniques like volume profile are often used in conjunction with market profile to provide a more comprehensive view of trading activity.
Traders typically use the market profile chart to identify key levels of support and resistance, as well as areas of value and control. It can also be used to analyze trends and patterns in trading activity, helping traders anticipate future price movements. Strategies such as order flow trading can further enhance the insights gained from market profile charts, making it a valuable tool for experienced traders.
It is important to note that market profile trading is a complex strategy that requires a high level of technical expertise and experience. Aspiring traders often learn to master these techniques, including order flow trading and volume profile analysis, by enrolling in the best trading academy in India. Such training provides a solid foundation in market dynamics and technical analysis, enabling traders to effectively use market profile trading strategies.
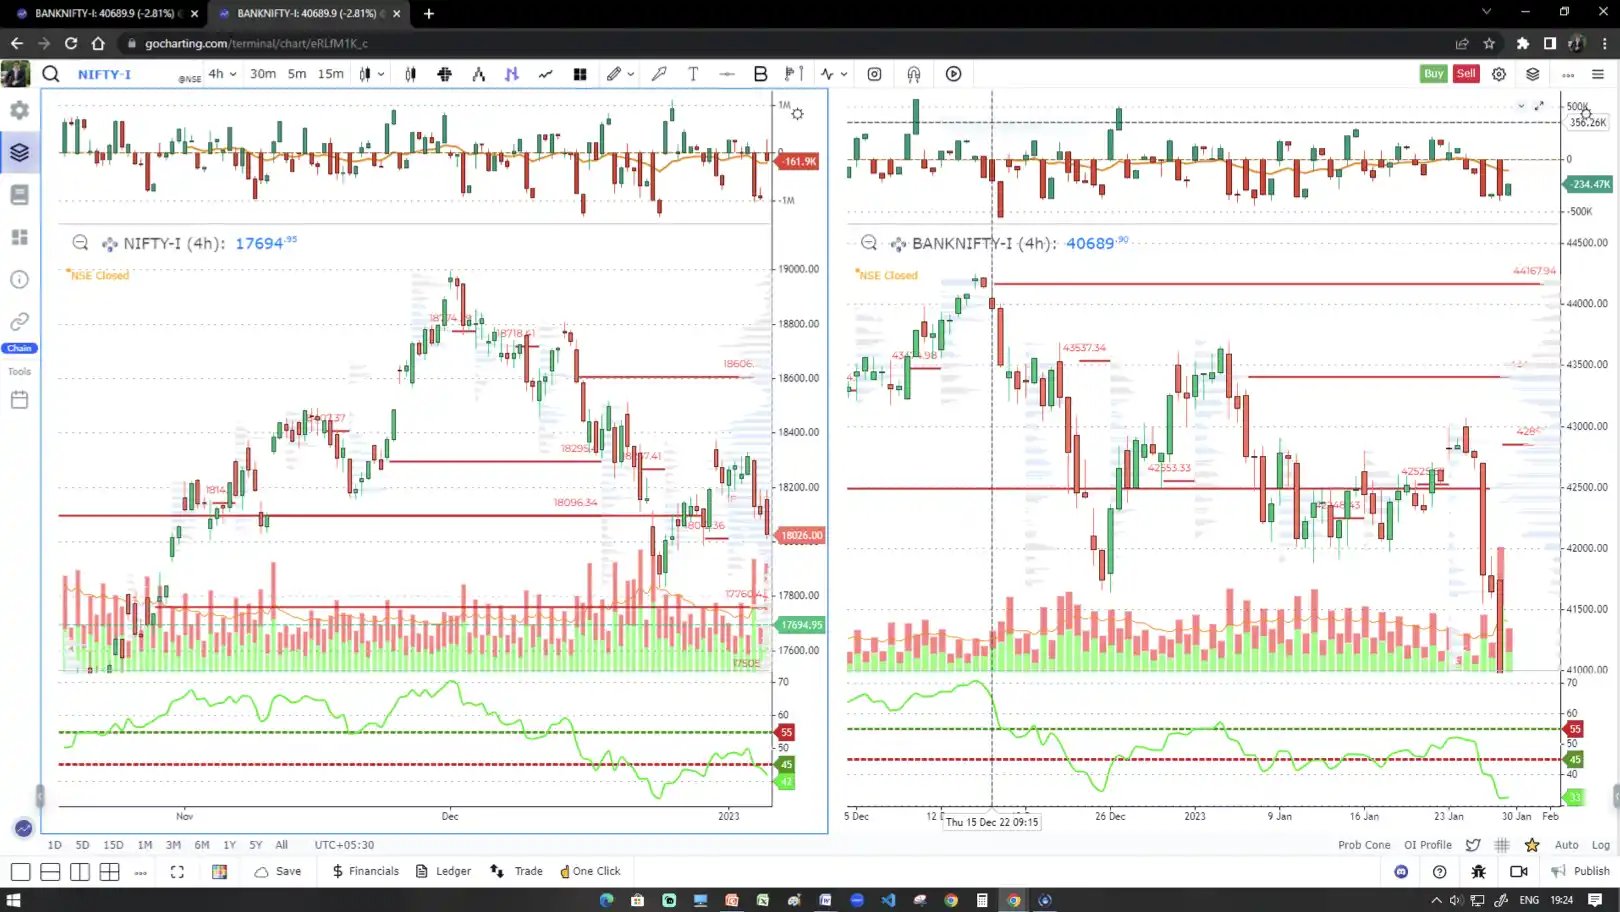
Volume profile is a charting method that uses volume data to provide insight into the buying and selling activity of market participants. It is based on the idea that volume, or the number of shares or contracts traded, can indicate market sentiment and reveal information about future market conditions.
The volume profile chart is a graphical representation of the trading activity for a financial instrument during a specific time period. It shows the distribution of volume at different price levels, highlighting areas of support and resistance and the relative importance of different price levels. Traders often combine volume profile with other tools such as order flow trading and market profile to gain a comprehensive understanding of market dynamics.
Traders who use volume profile trading strategies typically focus on analyzing the volume profile of a financial instrument over a specific time period. They may also use tools like order flow analysis and footprint charts to interpret the volume profile effectively.
Using volume profile, traders can identify key levels of support and resistance, as well as areas of value and control. By analyzing trends and patterns in trading activity, they can anticipate future price movements and make informed trading decisions.
It is important to note that volume profile trading is a complex strategy that requires a high level of technical expertise and experience. Many traders gain these skills through structured learning from the best trading academy in India, which specializes in techniques like order flow trading, market profile, and volume profile analysis. A solid understanding of market dynamics, technical analysis, and risk management is essential before attempting to use volume profile trading strategies.
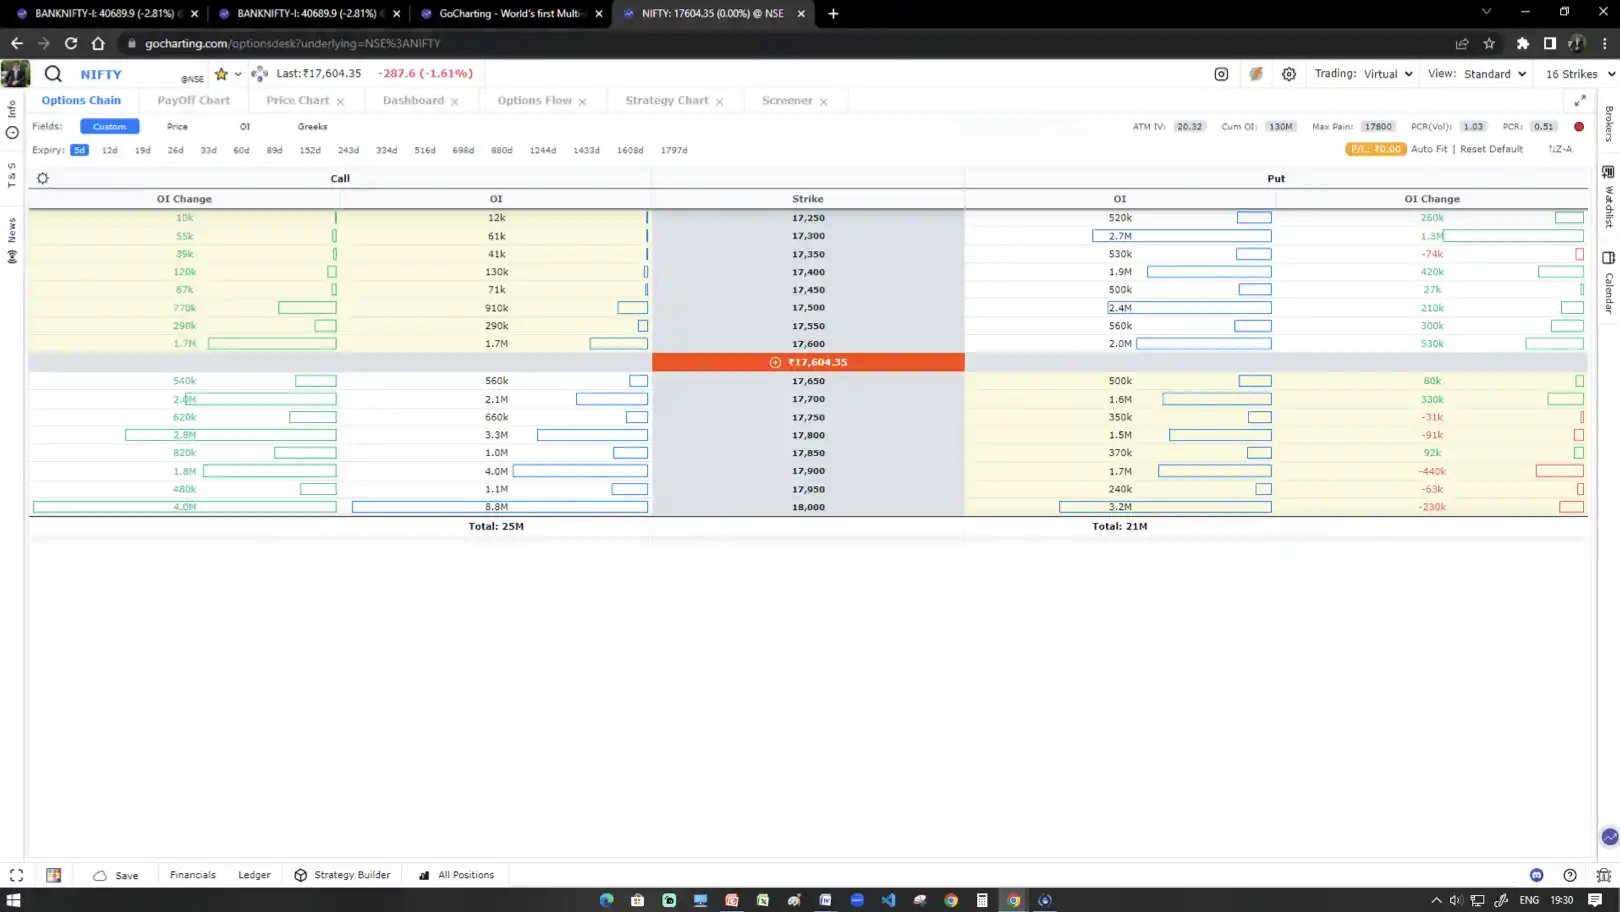
Open interest and PCR (Put-Call Ratio) are important indicators in option trading as they provide information about the market sentiment and the level of trading activity in the market. These indicators are often used in conjunction with advanced strategies like order flow trading and tools such as market profile and volume profile to gain deeper insights.
Together, open interest and PCR provide valuable insights into market sentiment and trading activity in the options market. These indicators are particularly useful when combined with techniques like volume profile analysis and order flow trading to create a more comprehensive trading strategy.
Traders often learn how to effectively use these indicators and integrate them with strategies like market profile through expert guidance at the best trading academy in India. However, it’s worth noting that these indicators should be used alongside other technical and fundamental analyses to provide a complete market perspective.
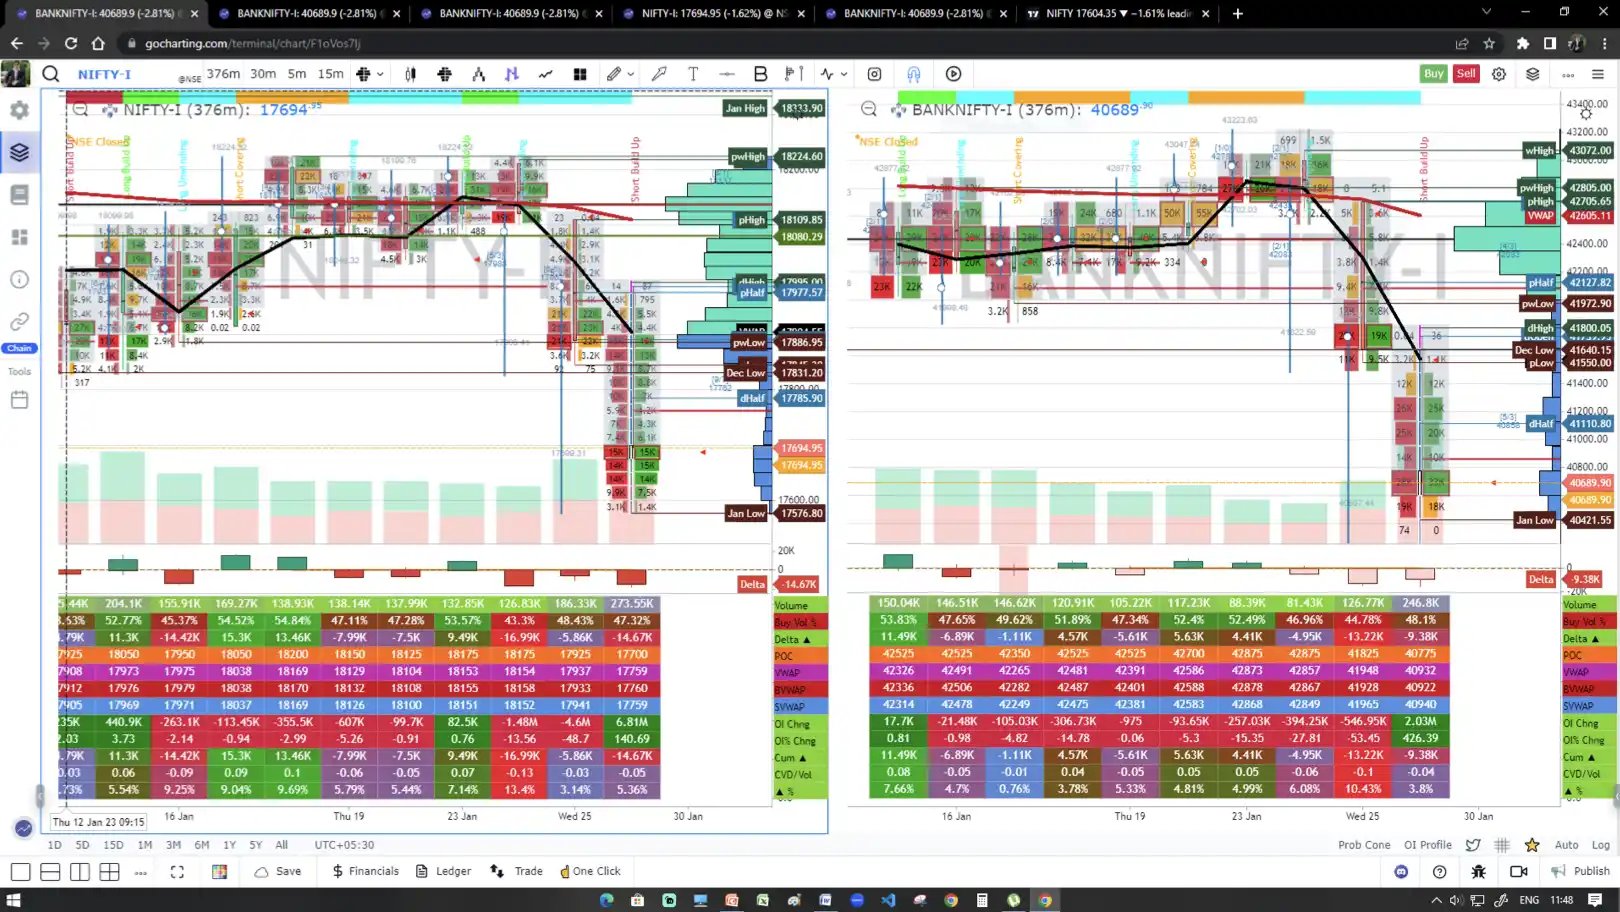
Point of Control (POC) is a concept used in technical analysis to identify the price level at which the most trading activity occurred during a specific time period. It highlights the price level where the market has been most active, serving as an indicator of market sentiment and the balance of supply and demand. Tools like market profile and volume profile are often used to calculate and analyze the POC effectively.
In trading, the point of control can act as a key level of support or resistance. When the market reaches the POC, it is likely to see a reaction from buyers or sellers. If the market trades above the POC, it is considered bullish, while trading below the POC is seen as bearish. Order flow trading strategies often incorporate POC analysis to anticipate market reactions and build trading plans.
The POC can also help identify potential areas for profit-taking or setting stop-loss orders. For instance, when the market is trading near the POC, traders may decide to take profits or place stop-loss orders at that level to safeguard their positions.
It is important to note that the POC is a historical measure and may change as new data and trading activity emerge. Traders often combine the POC with other indicators, such as volume profile, volume point of control, and delta, to form a more comprehensive understanding of market dynamics.
Many traders refine their skills in using tools like POC and strategies such as market profile and order flow trading through structured training provided by the best trading academy in India. Learning these advanced techniques can significantly enhance a trader’s ability to interpret market behavior and execute informed trading decisions.
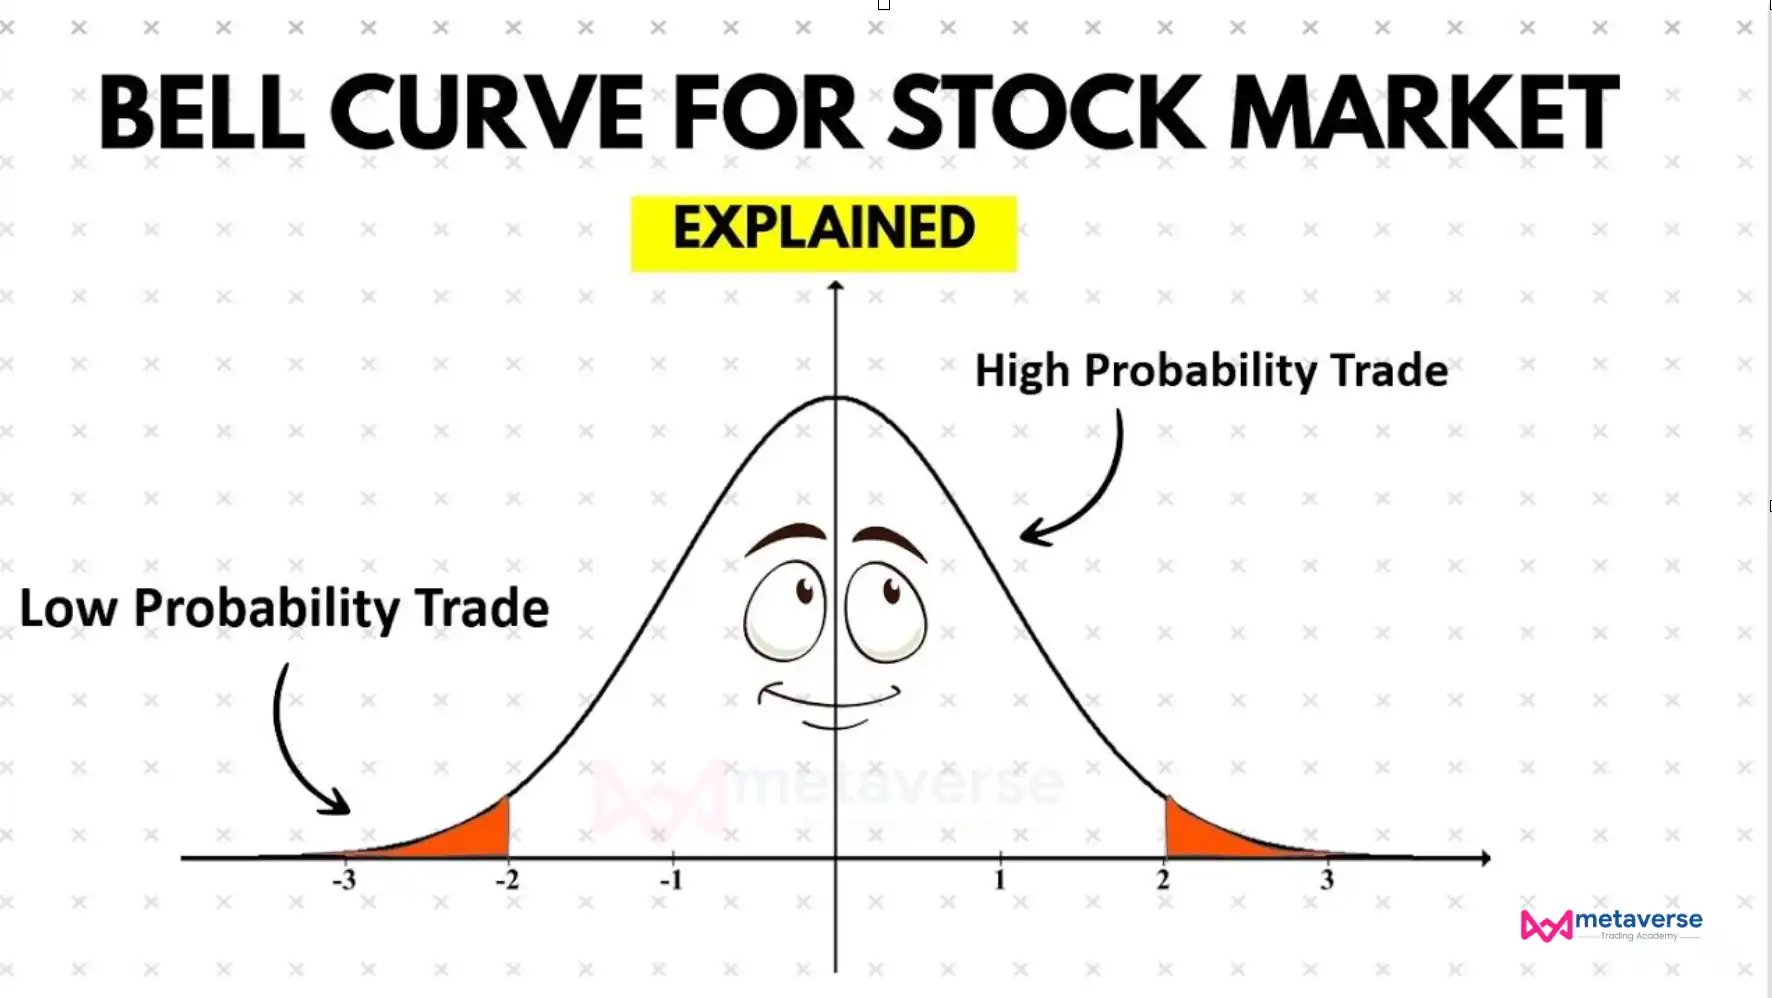
The Bell Curve is a statistical representation of a normal distribution, also known as a Gaussian distribution. In the context of market profile, it illustrates the distribution of prices for a particular stock, commodity, or financial instrument over a specified period of time. The bell curve market profile highlights the average price for the instrument, with deviations from the average represented by standard deviations, offering a clear visual representation of price distribution.
Market profile, including tools like volume profile, helps traders and investors understand price behavior by identifying market trends, support and resistance levels, and potential trade opportunities. By analyzing the bell curve in market profile, traders can gain insights into price acceptance areas and the market’s overall sentiment.
Order flow trading strategies often utilize the bell curve to pinpoint key areas of market activity and align trading decisions with prevailing trends. Aspiring traders can master these concepts and other advanced techniques by enrolling in the best trading academy in India, where they learn to integrate tools like market profile, order flow analysis, and volume profile into their trading strategies for better decision-making.
Institutional traders use a variety of tools to make trading decisions and manage risk. Some of the most common tools used by institutional traders include:
It’s worth noting that institutional traders often use a combination of these tools and may also use additional tools that are specific to their trading strategies and the markets they trade-in. Techniques like Market Profile, Volume Profile, and Order Flow Trading play a significant role in shaping strategies, making these tools indispensable for professional traders.
Order flow trading is a type of trading strategy that involves analyzing the flow of orders for a financial instrument to predict future price movements. It is based on the idea that the order flow, or the number and size of buy and sell orders, can indicate market sentiment and reveal information about future market conditions.
Traders who use order flow trading strategies typically focus on analyzing the order book, which is a record of all buy and sell orders for a financial instrument. They may also use other tools such as volume profile, auction market theory, and footprint charts to help them understand the order flow. Techniques like market profile also play a crucial role in interpreting market behavior and identifying potential trading opportunities.
Order flow traders often focus on short-term trades and use real-time data to make decisions. The strategy is commonly used in futures, forex, and equities markets but can be applied to other markets as well. Many traders learn these advanced techniques, including order flow trading, volume profile, and market profile, through expert guidance provided by the best trading academy in India.
It is important to note that order flow trading requires a high level of technical expertise and can be complex and challenging, making it unsuitable for every trader. It is essential for traders to have a solid understanding of market dynamics, technical analysis, and risk management before attempting to use order flow trading strategies. Training from the best trading academy in India can provide valuable insights and skills needed to master this sophisticated trading approach.
Market profile is a type of charting method that was developed by J. Peter Steidlmayer in the early 1980s. It is based on the idea that the price and time of a financial instrument can provide insight into the buying and selling activity of market participants and can be used to predict future price movements.
The market profile chart is a graphical representation of the trading activity for a particular financial instrument during a specific time period. It is divided into vertical “time price opportunities” (TPOs), which are horizontal blocks that represent a specific price range. The height of each TPO represents the volume of trades that occurred within that price range during a given time period. Techniques like volume profile are often used in conjunction with market profile to provide a more comprehensive view of trading activity.
Traders typically use the market profile chart to identify key levels of support and resistance, as well as areas of value and control. It can also be used to analyze trends and patterns in trading activity, helping traders anticipate future price movements. Strategies such as order flow trading can further enhance the insights gained from market profile charts, making it a valuable tool for experienced traders.
It is important to note that market profile trading is a complex strategy that requires a high level of technical expertise and experience. Aspiring traders often learn to master these techniques, including order flow trading and volume profile analysis, by enrolling in the best trading academy in India. Such training provides a solid foundation in market dynamics and technical analysis, enabling traders to effectively use market profile trading strategies.
Volume profile is a charting method that uses volume data to provide insight into the buying and selling activity of market participants. It is based on the idea that volume, or the number of shares or contracts traded, can indicate market sentiment and reveal information about future market conditions.
The volume profile chart is a graphical representation of the trading activity for a financial instrument during a specific time period. It shows the distribution of volume at different price levels, highlighting areas of support and resistance and the relative importance of different price levels. Traders often combine volume profile with other tools such as order flow trading and market profile to gain a comprehensive understanding of market dynamics.
Traders who use volume profile trading strategies typically focus on analyzing the volume profile of a financial instrument over a specific time period. They may also use tools like order flow analysis and footprint charts to interpret the volume profile effectively.
Using volume profile, traders can identify key levels of support and resistance, as well as areas of value and control. By analyzing trends and patterns in trading activity, they can anticipate future price movements and make informed trading decisions.
It is important to note that volume profile trading is a complex strategy that requires a high level of technical expertise and experience. Many traders gain these skills through structured learning from the best trading academy in India, which specializes in techniques like order flow trading, market profile, and volume profile analysis. A solid understanding of market dynamics, technical analysis, and risk management is essential before attempting to use volume profile trading strategies.
Open interest and PCR (Put-Call Ratio) are important indicators in option trading as they provide information about the market sentiment and the level of trading activity in the market. These indicators are often used in conjunction with advanced strategies like order flow trading and tools such as market profile and volume profile to gain deeper insights.
Together, open interest and PCR provide valuable insights into market sentiment and trading activity in the options market. These indicators are particularly useful when combined with techniques like volume profile analysis and order flow trading to create a more comprehensive trading strategy.
Traders often learn how to effectively use these indicators and integrate them with strategies like market profile through expert guidance at the best trading academy in India. However, it’s worth noting that these indicators should be used alongside other technical and fundamental analyses to provide a complete market perspective.
Point of Control (POC) is a concept used in technical analysis to identify the price level at which the most trading activity occurred during a specific time period. It highlights the price level where the market has been most active, serving as an indicator of market sentiment and the balance of supply and demand. Tools like market profile and volume profile are often used to calculate and analyze the POC effectively.
In trading, the point of control can act as a key level of support or resistance. When the market reaches the POC, it is likely to see a reaction from buyers or sellers. If the market trades above the POC, it is considered bullish, while trading below the POC is seen as bearish. Order flow trading strategies often incorporate POC analysis to anticipate market reactions and build trading plans.
The POC can also help identify potential areas for profit-taking or setting stop-loss orders. For instance, when the market is trading near the POC, traders may decide to take profits or place stop-loss orders at that level to safeguard their positions.
It is important to note that the POC is a historical measure and may change as new data and trading activity emerge. Traders often combine the POC with other indicators, such as volume profile, volume point of control, and delta, to form a more comprehensive understanding of market dynamics.
Many traders refine their skills in using tools like POC and strategies such as market profile and order flow trading through structured training provided by the best trading academy in India. Learning these advanced techniques can significantly enhance a trader’s ability to interpret market behavior and execute informed trading decisions.
The Bell Curve is a statistical representation of a normal distribution, also known as a Gaussian distribution. In the context of market profile, it illustrates the distribution of prices for a particular stock, commodity, or financial instrument over a specified period of time. The bell curve market profile highlights the average price for the instrument, with deviations from the average represented by standard deviations, offering a clear visual representation of price distribution.
Market profile, including tools like volume profile, helps traders and investors understand price behavior by identifying market trends, support and resistance levels, and potential trade opportunities. By analyzing the bell curve in market profile, traders can gain insights into price acceptance areas and the market’s overall sentiment.
Order flow trading strategies often utilize the bell curve to pinpoint key areas of market activity and align trading decisions with prevailing trends. Aspiring traders can master these concepts and other advanced techniques by enrolling in the best trading academy in India, where they learn to integrate tools like market profile, order flow analysis, and volume profile into their trading strategies for better decision-making.
iXceed Trading Academy has imparted successful training strategies and real-world applications that have helped earn the Excellence award of being the Best Trading Academy in India.
iXceed Trading Academy is best trading academy in india to learn stock trading using order flow, market profile, volume profile, option chain etc.
Investing/Trading in the stock market is subject to market risks, and there is no assurance or Read more